The Data Explorer
Here, one can visualize patterns of lymph node involvement for the patients in the database. The aim is to make it easy to explore the complex dataset and understand correlations between lymph node involvement in different levels and primary tumor characteristics. The basic concept is that buttons on the dashboard act as filters. They allow the user to select subsets of patients from the database. The GUI will then show the number (or percentage) of patients that show involvement in each lymph node level. As such, the dashboard may be used for generating hypotheses, meaning that you, the user, becomes curious and asks questions about correlations or whether lymph node involvement differs between certain patient groups. Most patient characteristics will be explorable using this interface, while others maybe not. In the latter case we encourage you to download the database and test your ideas and hypotheses with your own tools.
Warning: dashboard is NOT for predicting the risk of occult metastases in individual patients. All we do here is visualize data of previously seen patients. For actual predictions of occult disease given a diagnosis, head over to the riskpredictor.
Note: You may notice this help page is slightly out of date. We have published an updated and polished version of the data explorer that also changed the layout a bit. Nonetheless, the pictures and explanations below should still be helpful to understand the basic concepts of the dashboard.
Videos
Get started
Exploring hypotheses
Components
Patient details (top left)
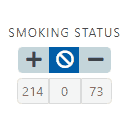
In this panel, one can narrow down the subset of selected patients based on criteria that characterize the patient as a whole, such as HPV status or whether they are smokers. To do so, put the toggle buttons in one of the following three states:
- Only patients are selected where the respective characterisitc is *positive*. E.g. in the case of "smoking status" this would select all smokers.
- This selection means that no filtering will be performed regarding the corresponding patient characteristic.
- Selecting this will only include patients in the subset that do not have the respective characteristic or it is negative (e.g. not-smoking or HPV negative).
Note: Just below the buttons there are three numbers that give a preview of how many of the currently selected patients can be categorized according to the respective characteristic. Here, the middle number indicates for how many patients the characteristic is unknown.
Note: All filters in the Patient characteristics panel are combined via AND operations. This means, if one selects + for HPV status and - for neck dissection, the selection includes only patients who are HPV positive AND did not receive neck dissction.
Warning: Dont forget to hit compute after you have changed your selection criteria.
Primary tumor (bottom left)
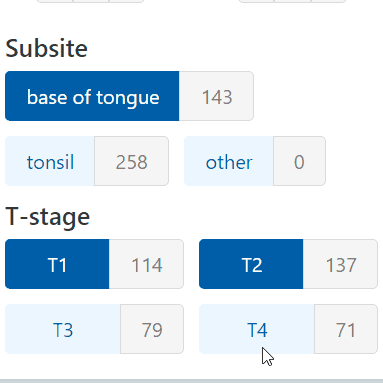
Filter the dataset further by tumor-specific details, like the lateralization of a patient's primary tumor, its location and/or T-category.
Next to the selected subsites and T-categories, this panel also displays how many patients presented with a tumor in the respective subsite / T-category.
Note: Both the subsites and T-categories are selected or deselected by clicking on the respective button. If it appears white on dark blue, it is selected. If it appears dark blue on light blue, it is deselected. For example, selecting 'T1' and 'T2' and 'Tonsil' will select all patients that have primary tumors located in the tonsil AND are T1 OR T2-category, i.e. different criteria are combined via AND operations whereas T-categories are connected via OR operations.
Institutions (center top)
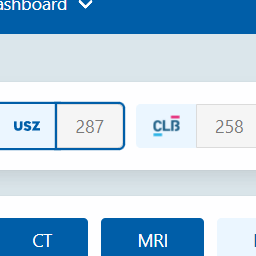
Since we collect and visualize datasets from different institutions here, one can of course select which ones should be considered. To do so, simply click on the respective institution's logo. It is selected, if the logo is outlined and deselected if it is not.
Modalities (center, below Institutions)
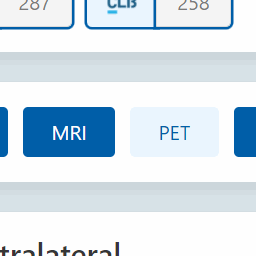
Choose which of the available modalities to include in the visualization. Only patients are considered that have at least one of the selected diagnoses available. One may choose how to combine these - possibly conflicting - diagnoses:
- logical OR: A lymph node level (LNL) is reported as metastatic or involved as soon as one of the selected diagnoses reports a positive finding. Anything else is reported as healthy.
- logical AND: LNL's are reported as involved only when all diagnoses agree on positive findings. If that is not the case, meaning that none or not all agree on such a finding, it is reported (rather optimistically) as healthy.
- maxLLH: This computes the most likely involvement based on all available diagnostic modalities and their respective sensitivities & specificities for a patient.
- rank: Similar to the maxLLh method, this uses the sensitivities & specificities of the available diagnostic modalities, but instead of combining all diagnoses into one, it accepts the most trustworthy diagnose for a given patient.
The sensitivities & specificities used are listed below:
| Modality | Specificity | Sensitivity |
|---|---|---|
| % | % | |
| % | % | |
| % | % | |
| % | % | |
| % | % | |
| % | % | |
| % | % |
contra- (center left) & ipsilateral (center right)
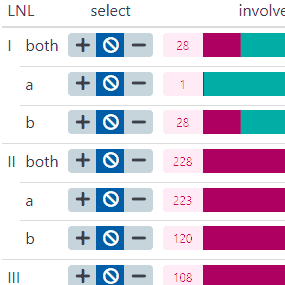
Here the most important information is visualized. For each side of the neck (ipsilateral being the same side as the tumor, contralateral the opposite) it displays a row for each LNL. From left to right, that row consists of...
- its roman numeral label (e.g. IV)
- a three-way toggle-button to select a subset of patients that show metastases in that LNL () or are reported healthy (). Selecting the middle button () means that no filtering is performed
- and a horizontal stacked bar that displays the ratio of patients with reports of metastases in that LNL to patients that appear to have a healthy LNL. Numbers to the left and right of that bar plot indicate the absolute numbers and give a brief explanation when hovering over them with the mouse pointer.
Note: If for some patients the involvement in a LNL is unknown, these patients are represented by the middle bar. This may for example occur when selecting FNP is diagnostic modality, which is performed only in selected LNL.
Buttons (bottom right)
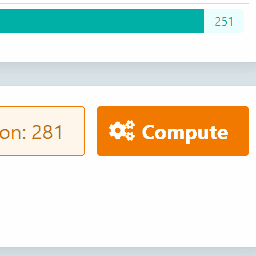
From left to right the three buttons here are
- the help button in light blue, opening this very menu
- an info button in light orange that shows how many patients are in the currently narrowed-down subset and that redirects to a list of patients in that subset when pressed
- the compute button in bright orange, which sends a request with the current selections to the server for an update of the visualized statistics
Finally, on the left in this box one can toggle between displaying absolute numbers or percentages.
Examples
Full example
Below is an annotated screenshot of a concrete example for how to use the dasboard.

The bar plots
Here we have annotated the bar plots showing the actual involvement numbers and statistics. In this case we're looking at a concrete example for the ipsilateral levels III and IV. Note that the absolute numbers are displayed. If one switches views, all the number here become percentages.

Contribute
Data
The most straightforward way to support our goal of improving CTV-N definition by better quantifying the patterns of lymphatic progression is to share data from your institution. We would recommend that - if you have data with a sufficient amount of detail - you submit that dataset e.g. to a journal like Data in Brief.
Doing so has a number of benefits:
- You'll get citations for your work
- We can use your data and attribute you properly
- It's actually pretty simple and quick to prepare the Data in Brief submission
In case you are unsure in which format to publish the data or in which repository to store it, feel free to contact us and we willl gladly help you with it!
Features
If you think our dashboard (or other parts of the interface) are missing some critical features, we would love to learn about it, so that we can expand and adapt the functionalities according to what you need.
The best way for us to tell us what features and functionalities you'd like to see is if you could open an issue on the GitHub page of the project by simply clicking on the New Issue button and then describing what you have in mind.
Otherwise just email us at jan.unkelbach@usz.ch